
During periods when global trade is disrupted by geopolitical developments, tariffs or financial shocks, countries whose exports are concentrated in a limited number of products or regions are affected more. Therefore, diversifying exports across products and markets increases resilience to such shocks. This blog post analyzes the evolution of Türkiye’s export diversification over time, in comparison with selected emerging economies.
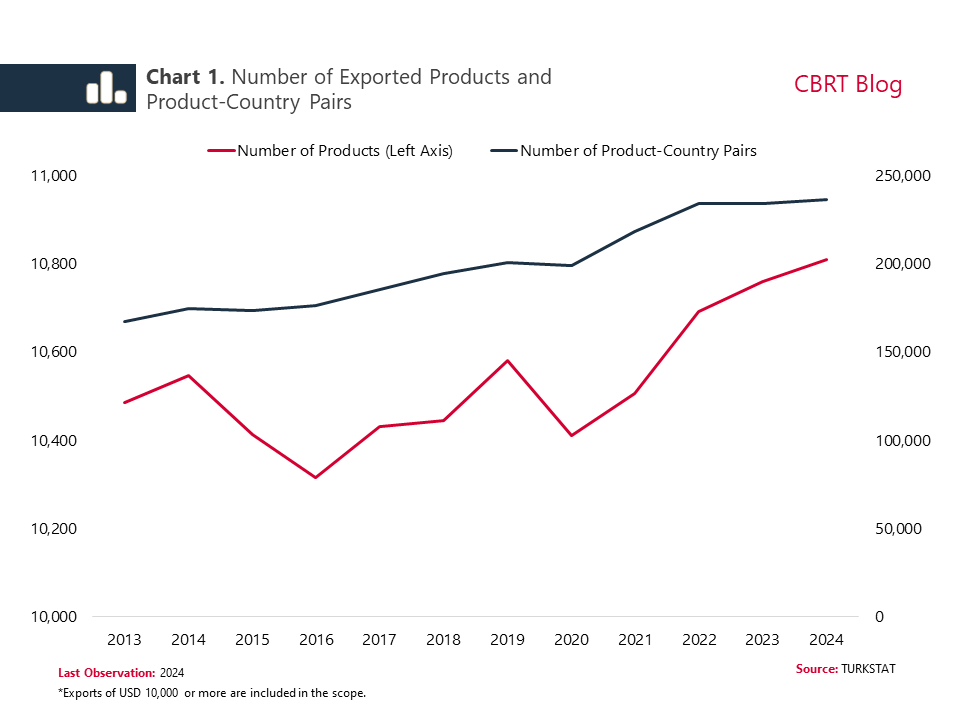
For the period between 2013 and 2024, we calculate the number of distinct products and product-country pairs in Türkiye’s exports using the 12-digit GTIP (Customs Tariff Statistics Position)[1] codes (Chart 1). Accordingly, the number of products exported increased from 10,487 to 10,810 during this period, while the number of product-country combinations grew by over 40%, rising from 167,459 to 236,864. This indicates that Türkiye’s export network has become more complex and resilient.
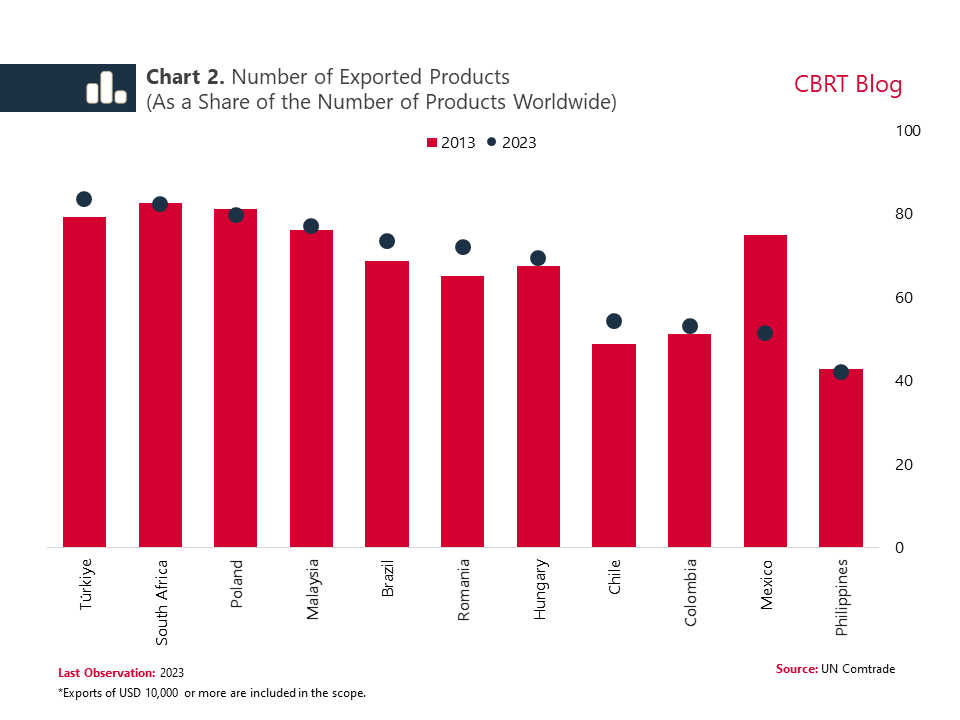
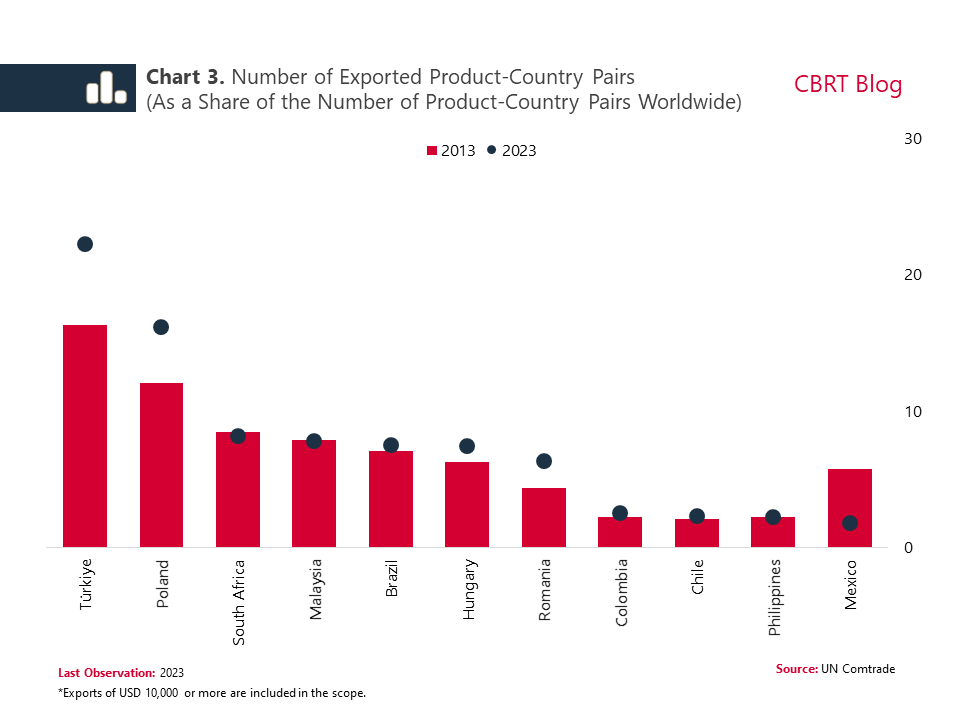
However, this increase may not accurately reflect whether Türkiye has been successful in improving its export diversification if the number of exported products or product-country combinations has also risen globally. Therefore, to gain a better insight into Türkiye’s export diversification, it is necessary to consider the export diversification trends of other countries as well. To that end, we calculate the ratios of the number of exported products and product-country pairs to the total number of such items exported worldwide for Türkiye and selected emerging economies. Charts 2 and 3 present these comparisons based on the 6-digit HS product classification, with the red bars representing 2013, and the black dots 2023.[2]
In terms of the number of exported products, Türkiye was able to export approximately 84% of the products traded globally in 2023. This figure, which is high compared to the other countries in the group, represents an increase of 4.3 percentage points since 2013. As for the number of product-country pairs, Türkiye significantly outperformed the countries in the comparison group in both 2013 and in 2023.[3] To interpret the 2023 data: Türkiye appeared in 22 out of every 100 markets for globally exported product-country pairs. Considering that this figure was 16 out of 100 in 2013, it is evident that significant progress has been made in this area.
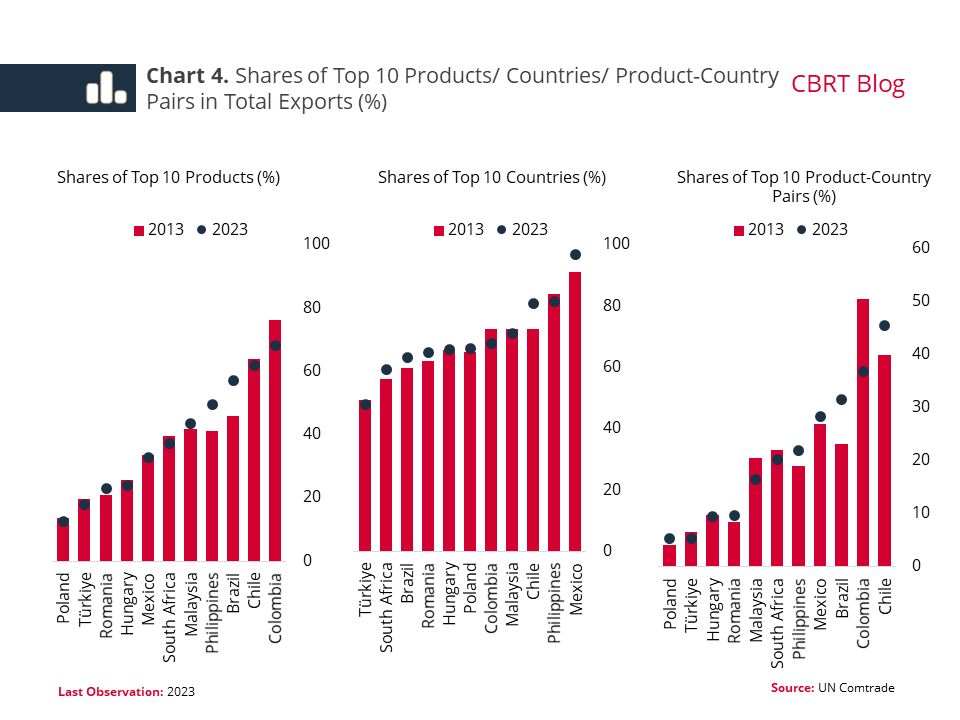
Although the number of product-country pairs is an indicator of export diversification, it does not fully capture the distribution of exports. Even when a country exports a large number of products to a large number of countries, its exports may still display concentration in certain areas. Therefore, we calculate the shares of each country's top 10 products, top 10 destination countries and top 10 product-country pairs in total exports for the years 2013 and 2023 (Chart 4). Accordingly, Türkiye ranks among the countries with the lowest level of concentration in both periods—across products, countries and product-country combinations.
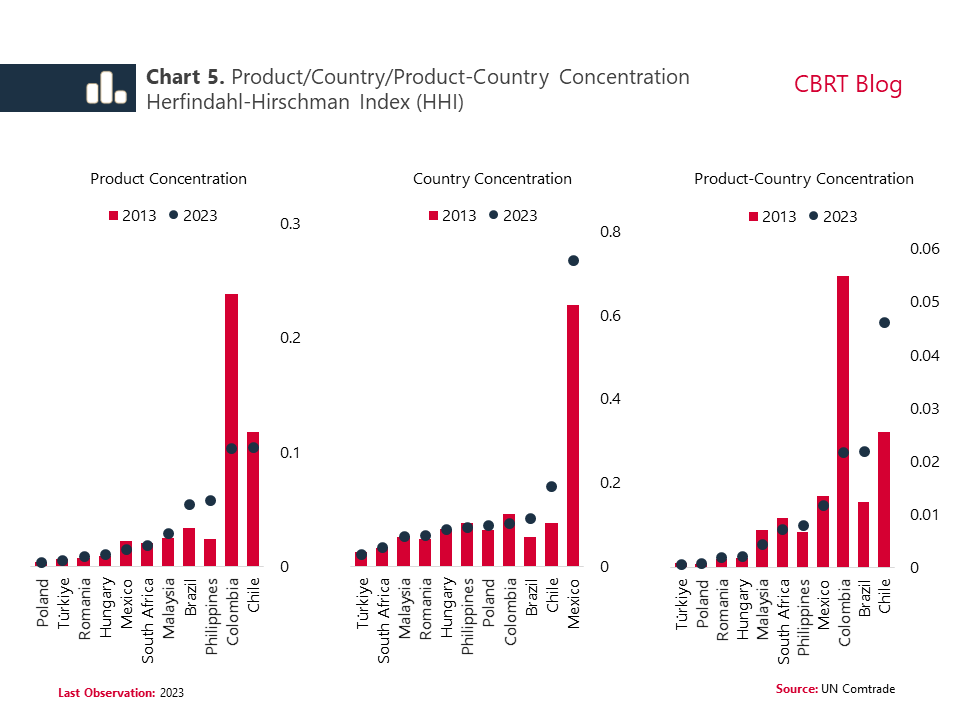
We also present the Herfindahl-Hirschman Index (HHI), another commonly used measure of concentration—for products, countries, and product-country pairs for 2013 and 2023 with a cross-country comparison in Chart 5. A lower HHI value indicates that exports are more evenly distributed and less concentrated. Accordingly, within the group, Türkiye ranks second lowest in concentration by product, and leads with the lowest concentration by destination country and product-country pairs. These observations indicate that, in comparison to the other countries analyzed, Türkiye’s exports are not heavily dependent on a specific product group or product-country pair. In other words, they demonstrate Türkiye’s relatively strong performance in export diversification.
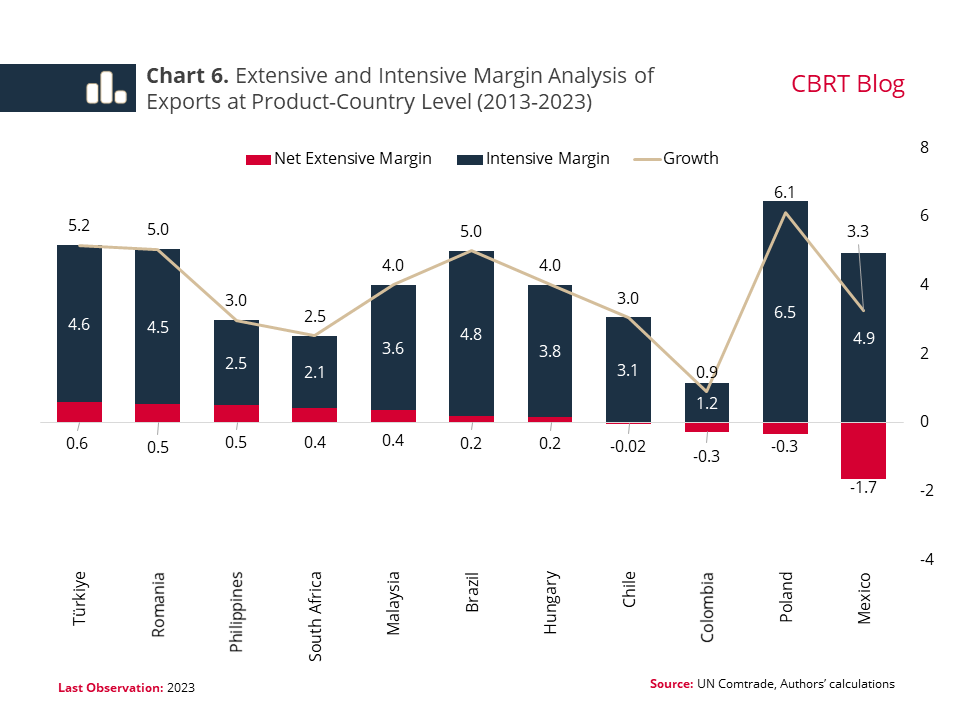
Lastly, for each country, we calculate the contributions of new markets (extensive margin) and export growth in existing markets (intensive margin) to the average export growth at the product-country level during the 2013-2023 period (Chart 6). Having the second-highest average export growth among the countries in question, Türkiye also records the largest contribution from the extensive margin. This indicates that Türkiye has performed relatively well both in expanding its exports through new products and markets, and in deepening its existing trade relationships.
In summary, the data reveal that Türkiye’s export structure has become more resilient, with increased diversification in both products and destination countries. The increase in the number of products and especially in the number of product-country pairs indicates that Türkiye’s integration into global trade has strengthened. Moreover, the balanced distribution of exports increases resilience against external shocks. Finally, while export diversification is an important indicator, it is also useful to factor in developments in value added and technology to better gauge the overall improvement in export performance.
[1] Tariff schedule as used in the Turkish Tariff Nomenclature. The first six digits indicate the Harmonized System (HS) codes.
[2] Comparisons with other countries are based on the 6-digit HS classification, which offers the most detailed breakdown of international trade data.
[3] A comparison of the periodic averages for 2011-2013 and 2021-2023 reveals a similar picture.